-

-

-
 PT | EN
PT | EN 

A previous analysis conducted by CEBRI (Corrêa do Lago & Cimini 2026) on the performance of the Trade Balance in 2025 observed that Brazil's foreign exchange revenue had benefited significantly from windfalls in 3 specific sectors–beef, coffee and vehicles, totaling approximately US$ 11 billion–which, individually, more than compensated for the drop in revenue from exports to the US; however, it warned that, since it only occurred in the second half of the year, the negative variation of US$ 2.6 billion in total exports to the US in 2025 constituted an underestimation of the “cost” resulting from the new American tariff policy. The abrupt drop (≈20%) that occurred from August onwards–when the monthly average fell from ≈US$ 3.5 billion to a new level of ≈US$ 2.5 billion–corresponds, in total recorded sales to the American market, to an annualized value of US$ 30 billion (compared to US$ 40 billion in 2024 and US$ 37.7 billion in 2025).
Therefore, the Brazilian trade balance begins 2026 with a potential handicap of approximately US$20 billion compared to 2025: (a) due to the likely non-recurrence of the exceptional performance observed in 2025 in the three sectors mentioned above; (b) and, in the American market, if there is no recovery of the market share lost from the second half of 2025 onwards.
This unfavorable trend appeared to continue throughout the first quarter of 2026.
- Regarding the US, exports showed no reaction, remaining at the "new post-tariff level" (average of US$ 2.5 billion) that has prevailed since the second half of 2025;
- In coffee and vehicle exports–which had hit record highs in 2025–the drop in revenue was, respectively, 20% (due to prices) and 9% (due to volume);
- In the beef sector, which showed mixed signals: although the sector expects the volume of exports to China in 2026 to be 35% lower than in 2025–due to the reduction of the quota to 1.1 million tons (compared to exports of 1.68 million tons in 2025)–the performance in the first quarter (37% above the same period in 2025) gives the illusion of significant growth, when in reality it is a massive frontloading of the new quota, which, according to the sector, should be filled by May; the consequence of this exceptional volume in the first months of the year will be a corresponding reduction in the second half of the year.
TRADE FLOW PERFORMANCE
The unfavorable bias mentioned above seems, at first glance, to be "disproved" by the positive figures for the 1st quarter released by the MDIC: growth of 4.4% in the trade flow (US$ 150.5 billion) and 47.6% in the trade balance surplus (US$ 15 billion in 2026 vs. US$ 9 billion in 2025), resulting from growth in both exports (7.1%) and imports (1.3%).
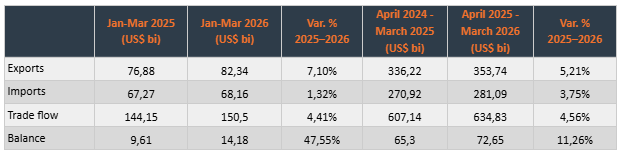
Table 1 – Trade Balance: 1st quarter 2025 and 2026 and 12-month moving average (in US$ billion).
However, a closer examination of the numbers shows that the positive performance of the trade flow in the quarter was mainly due to some contingent commercial movements, concentrated in specific items–such as: oil, gold, copper, soybeans and beef, on the export side, and electric cars and oil drilling equipment on the import side–and in few countries (China, India, South Korea, the European Union and the United Arab Emirates), showing a relative stagnation in areas that had demonstrated dynamism in 2025, such as Mercosur (-12%) and ASEAN countries (-1.3%).
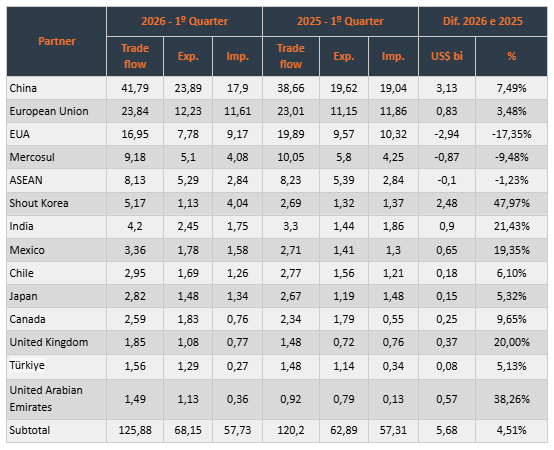
Table 2 – Trade Flow - 1st Quarter 2026 and 2025 (in US$ billion)
In the inter-quarterly comparison (2026 and 2025), it can be observed that:
a) In trade with the US, the restrictive effects of the policies adopted in August 2025 persisted, accumulating a ~15% drop in trade flows ( - 18,7% in exports and - 11,1% in imports);
b) China increased its share of Brazilian trade (28%), presenting a 8% growth: the growth of Brazilian exports by 21%, was partly due to the frontloading of the (annual) beef quota, but mostly due to the exceptional growth of 123% in oil sales. On the import side, the highlight was the increase in purchases of electric cars, in anticipation of tariff increases: the item "Import of vehicles and accessories" jumped from an annual total of US$ 763 million in 2025 to a value of US$ 2.16 billion in the 1st quarter, signifying a growth of 182%;
c) The significant growth observed in trade with South Korea, India, and the UAE appears as one of the first tangible results of the Brazilian commercial diplomacy efforts aimed at expanding and diversifying market access: unlike South Korea, whose jump in imports in the first quarter (from US$ 1.37 billion in 2025 to US$ 4.04 billion in 2026) is explained by a one-off event–the purchase of a drilling platform worth US$ 2.4 billion–the recent opening of the Indian market to Brazilian oil (imports worth approximately US$ 1 billion in the quarter) has a recurring character, with the country having become the second largest destination for Brazilian oil; in the case of the UAE, the US$ 1 billion increase in trade is due to a “two-way street” (Brazilian gold exports and diesel imports);
d) High growth rates, in relative terms, can also be observed in Mexico (24%), Vietnam (17%), Canada (10%) and Turkey (5%), which, however, do not yet translate into significant values in absolute terms.
EXPORT PERFORMANCE–MAIN ITEMS
Brazilian exports for the period January-March 2026 are examined, in Table 3, from two distinct angles:
a) the inter-quarterly comparison (column “c”), in which numerous items, in Jan-Mar 2026, show positive rates compared to the Jan-Mar 2025 period;
b) the comparison between the average monthly revenue in the 1st quarter of 2026 with the annual average in 2025 (column “f”), which points–in a longer perspective–to a combination of absence of growth with a drop in (average) revenue in almost all items, including numerous items that, in the inter-quarter comparison, appear with positive variation, such as: soybeans, corn, beef, iron ore, equipment & machinery and aeronautics.
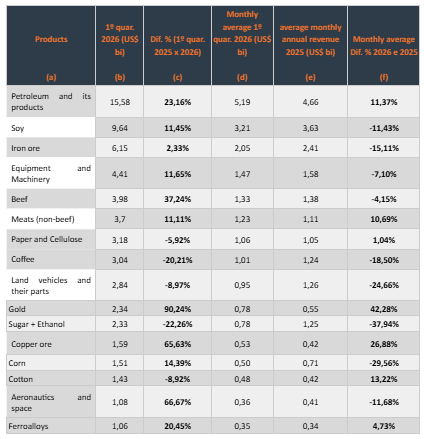
Table 3 – Exports 1st quarter of 2026: main items (US$ billion).
The items that showed positive rates under both criteria were:
a) Value-store assets: primarily gold (+90% quarter-on-quarter and 42% year-on-year), which explains the increase in exports to major financial centers such as the United Kingdom, Switzerland, and the United Arab Emirates; and strategic minerals needed for the energy transition, such as copper ore (+65% quarter-on-quarter and 26% year-on-year);
b) Oil (+15% compared to the previous quarter and 11% compared to the previous year), whose exceptional performance was not (yet) due to the price surge following the start of hostilities in the Gulf (the average price of US$ 59.1/barrel for shipments made in January-March 2026 reflects market levels in 2025), but rather to the spectacular growth–in volumetric terms–of oil imports by China (+US$ 3.6 billion) which, in a short period of time, more than doubled its import volume from Brazil, going from 7.5 billion tons to 16 billion tons (+123%).
IMPORT PERFORMANCE–MAIN ITEMS
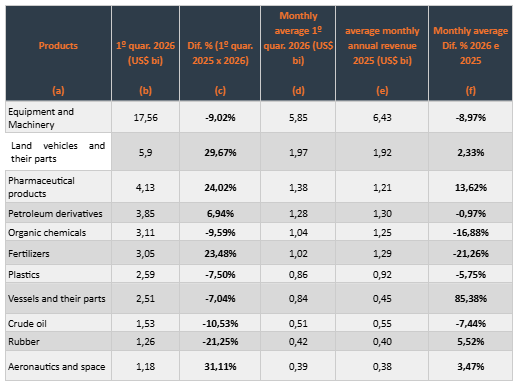
Table 4 – Imports 1st quarter of 2026: main items (US$ billion).
Regarding Brazilian imports, the data for the first quarter indicates:
- a loss of dynamism in the growth rate of imports, when comparing the quarterly average (+1.3%) and the annual rate (6.66%) in 2025;
- This loss of dynamism in most items is reflected in the comparison between average revenues in the 1st quarter and average revenues observed in the year 2025 (column “f ”), including items that showed positive variation in the inter-quarter comparison (column “c”);
- a shift in the pattern of import composition in favor of durable consumer goods (+26% in vehicle imports, rising from US$4.5 billion in 2025 to US$5.9 billion in 2026), contrasting with a decrease (-9%) in capital goods imports (US$17.6 billion in 2026 vs. US$19.3 billion in 2025 in the "Machinery and Equipment" category);
- Supply sources became more diversified: significant increases in Mexico (+53%), the United Kingdom (+39%), and Taiwan (+18%) partially offset the 42% reduction in US imports of "Machinery and Equipment"; the 305% growth (from US$74 million in 2025 to US$299 million in 2026) in diesel imports from the UAE more than compensated for the reduction in supply from the two largest exporters to Brazil (Russia and the USA); in the area of fertilizers–considering the dependence of Brazilian agribusiness on a small number of countries–the addition of Turkmenistan as a new and relevant supplier was particularly significant: the value of US$237 million in the first quarter compares favorably to that of Brazil's two largest suppliers: 33% from Russia (US$700 million) and 62% from Canada (US$380 million).
FINAL CONSIDERATIONS
The figures for the first quarter of 2026 highlight the following aspects:
Signs of a loss of dynamism in imports (growth rate of 1.3% in 2026 vs. 6.6% in 2025) accompanied by a shift in their composition, with a reduction in the import of capital goods and an increase in the import of consumer goods (notably electric cars).
A decline (compared to the annual averages observed in 2025) in revenues for almost all items on the export agenda, offset by exceptional growth in a few items, especially sensitive to increased uncertainty in the geopolitical scenario: store-of-value assets (gold and strategic minerals) and oil (large volumetric growth by China and India).
The persistence, in relation to the American market, of the unfavorable conditions resulting from the new customs policy, reflected in the 18% drop in exports and the 11% drop in imports, when comparing the first quarter of 2026 with that of 2025.
Regarding China, strong dynamism was maintained in both exports (with the exceptional quantitative redirection of oil purchases toward Brazil) and imports (record numbers in the sale of electric cars).
In the pursuit of diversifying trade flows, both geographically and in terms of expanding the range of products, some significant, albeit isolated, advances emerged, such as the increase in trade flows with South Korea and India, and the identification of new supply sources such as Turkmenistan (fertilizers) and the UAE (diesel). However, the initiative that–from a structural point of view–offers the broadest perspectives (combining trade, investment, and integration into production chains) is the Mercosur-EU Agreement, which will enter into force in May 2026.
Despite significant progress towards greater diversification, the growth in trade flows in the first quarter of 2026 was driven less by structural adaptation of Brazilian foreign trade to its main challenges than by cyclical movements (oil, gold), reflecting the growing geopolitical tensions in the international arena.
References
Corrêa do Lago, Manoel & Fernanda Cimini. 2026. “A balança comercial brasileira em tempos de protecionismo: o imperativo da diversificação.” CEBRI-Journal: online. https://cebri.org/revista/br/artigo/258/a-balanca-comercial-brasileira-em-tempos-de-protecionismo.
Submitted: May 13, 2026
Accepted for publication: May 14, 2026
Translation published: June 9, 2026
* Translated by Theo Pereira with the support of digital machine translation tools: Google Translate (initial draft), Grammarly (grammatical and syntactic revision), and ChatGPT (selective phrasing refinements). Reviewed by the author.
Copyright © 2026 CEBRI-Journal. This is an Open Access article distributed under the terms of the Creative Commons Attribution License, which permits unrestricted use, distribution, and reproduction in any medium, provided the original article is properly cited.
